Look — Do You See the Noise Leaking Through That Ceiling?
Acousticians often need to communicate complex, 3-D acoustical phenomena that occur within and between rooms to architects, interior designers, and other visually-oriented professionals.
However, the message can get lost when translating quantitative acoustics metrics and their acronyms into the design and intersection of building elements like walls and ceilings. This is where color-sound mapping technology comes into play.
The Role of Color-Sound Mapping in Building Design and Construction
The intricacies of sound behavior — such as how noise travels between rooms or interacts with surfaces — are typically conveyed through quantitative metrics and technical acronyms. But these details can get lost in translation when applied to the practical aspects of building design, like the placement and material choices for walls and ceilings.

The Optimized Acoustics™ approach aims to address this communication gap by transforming sound absorption and isolation data into visually intuitive representations through color-sound mapping.
How Does Color-Sound Mapping Work?
Using a color mapping technique akin to thermal imaging, sound intensity probes capture the transmission of noise through acoustic ceiling systems and how sound reflects off or is absorbed by various surfaces.
These high-definition color maps visually represent the sound intensity, making it easier for designers to understand and incorporate acoustic considerations into their work.
This innovative approach not only bridges the technical and visual aspects of acoustics and design but also fosters more effective collaboration between acousticians and design professionals. Ultimately, this leads to spaces that are both acoustically and aesthetically optimized.
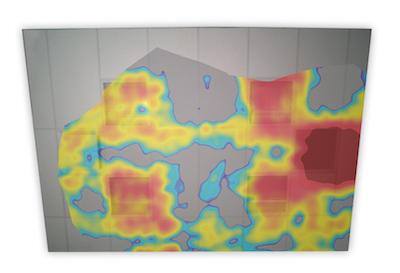
The above is the abstract taken directly from the paper written by Dr. Gary S. Madaras based on research work completed here at NGC Testing Services facilities. This image was taken with Soft dB’s I-Track system. The color shows the loudness of the noise generated in the source side and transmitted through the ceilings and plenum into the receiver side. The ‘hotter’ the color, the louder the noise leaking through that part of the ceiling. So you can see that the loudest noise is due to the open return air grille on the right. But overall, the image shows how the utilities (4 lights in the center, supply air diffuser on the left and return air grille on the right) result in substantial noise flanking paths that degrade the ceiling system performance up to 10 CAC points compared to the ceiling panel CAC rating.
Color-Sound Mapping and Acoustical Testing
Acoustical testing typically involves measuring various sound characteristics, such as sound transmission, absorption, and reflection within a building or specific room.
These measurements are often presented in quantitative terms, such as decibel levels or sound transmission class (STC) ratings, which can be difficult for non-acousticians to interpret and apply to design decisions. Color-sound mapping translates these quantitative measurements into visual data.
Have questions about our acoustical testing services? Send us a message.
This post was originally published on September 3, 2021, by Bob Menchetti and was updated and republished in August 2024.